Power BI problems that require accessing previous rows of data can be difficult in Power BI, one way of resolving this is to translate columns into lists and then process the lists. This is an example that performs debtors aging, where we have one payments and five aging buckets that we wish to allocate those payments into. Please refer to my previous post http://mikeallen.com.au/post/Creating-an-Aging-Calendar-in-Power-Query as to how the aging buckets are created and assume that transactions have been grouped similar buckets numbered B1 thru B5.
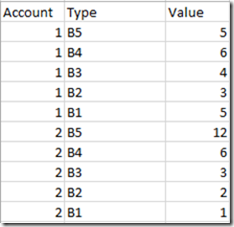
Here is some sample data:

Here are the payments:

The method I’m going to use to age involves comparing the payment to the cumulative debt on the account going from B5, the oldest to B1 the newest, so I need to get the data to look like this:

When I have this data I then apply this formula to each line to calculate the aging value:
if [Payment] >= [Cumulative] then 0
else if [Payment] < [Cumulative] and [Payment] > ([Cumulative] - [Actual])
then [Cumulative] - [Payment] else [Actual])
This handles the three cases of a fully paid, partially paid and unpaid buckets in one calculation, which I think is pretty neat!
Here is the Power Query that does all this, this is a Beta, I’m still refining it. The data is held in an Excel workbook in the format as shown above:
let
Source = Excel.Workbook(File.Contents("BucketAging.xlsx"), null, true),
Buckets_Sheet = Source{[Item="Buckets",Kind="Sheet"]}[Data],
#"Promoted Headers" = Table.PromoteHeaders(Buckets_Sheet, [PromoteAllScalars=true]),
#"Removed Other Columns" = Table.SelectColumns(#"Promoted Headers",{"Account", "Type", "Value"}),
GroupRowsByAccount = Table.Group(#"Removed Other Columns", {"Account"}, {{"DataTable", each _, type table [Account=number, Type=text, Value=number]}}),
MergePayments = Table.NestedJoin(GroupRowsByAccount, {"Account"}, Payments, {"Account"}, "Payments", JoinKind.LeftOuter),
ExpandPaymentValue = Table.ExpandTableColumn(MergePayments, "Payments", {"Value"}, {"Value"}),
RenamedPaymentColumn = Table.RenameColumns(ExpandPaymentValue,{{"Value", "Payment"}}),
AddBucketNumbers = Table.AddColumn(RenamedPaymentColumn, "Bucket", each List.Numbers(1,5)),
ExpandBuckets = Table.ExpandListColumn(AddBucketNumbers, "Bucket"),
AddAgingList = Table.AddColumn(ExpandBuckets, "AgingList", each [DataTable][Value]),
AddCumulativeValue = Table.AddColumn(AddAgingList, "Cumulative", each List.Sum(List.FirstN([AgingList],[Bucket]))),
AddActualValue = Table.AddColumn(AddCumulativeValue, "Actual", each [AgingList]{[Bucket]-1}),
AddAgingCalc = Table.AddColumn(AddActualValue, "Aging", each if [Payment] >= [Cumulative] then 0
else if [Payment] < [Cumulative] and [Payment] > ([Cumulative] - [Actual])
then [Cumulative] - [Payment] else [Actual]),
AddBucketList = Table.AddColumn(AddAgingCalc, "AgingBuckets", each [DataTable][Type]),
AddAgingBucket = Table.AddColumn(AddBucketList, "AgingBucket", each [AgingBuckets]{[Bucket]-1})
in
AddAgingBucket
That’s all expanded out, so remove the columns that you don’t want.
I’ve tried to make the code self-documenting, it is conceptually fairly simple, you group the data down to a row for each account, expand it out for each bucket (in reverse order), then convert the values into a list and perform arithmetic on the list values while extracting the values back out again. Have a play, Lists in Power Query make it possible to do computation across rows of data.
This technique has been tested on several thousand accounts and performs well, any feedback is appreciated, this information is provided with no guarantee whatsoever  .
.
: